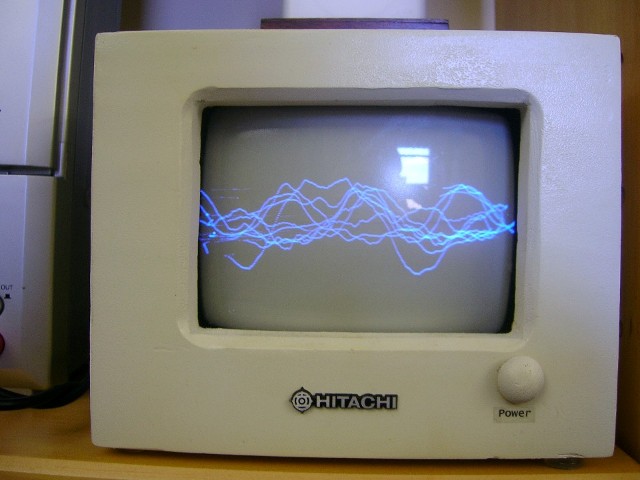
Here's the wave vessel, also known as an osilloscope, that I made from Censtron's how-to. Basically, this is made from an old -or in my case, new but very cheap- T.V. After some simple changes, the T.V. acts as an audio visualizer, similar to that on iTunes or Media Player. All that is required of this super easy mod is a soldering iron, solder, and a spare 3.5mm audio jack. The how-to shows a switch as well, in order to change from one visualization mode to another, but I found that one of the modes is much cooler than the other, so I just omitted the switch.
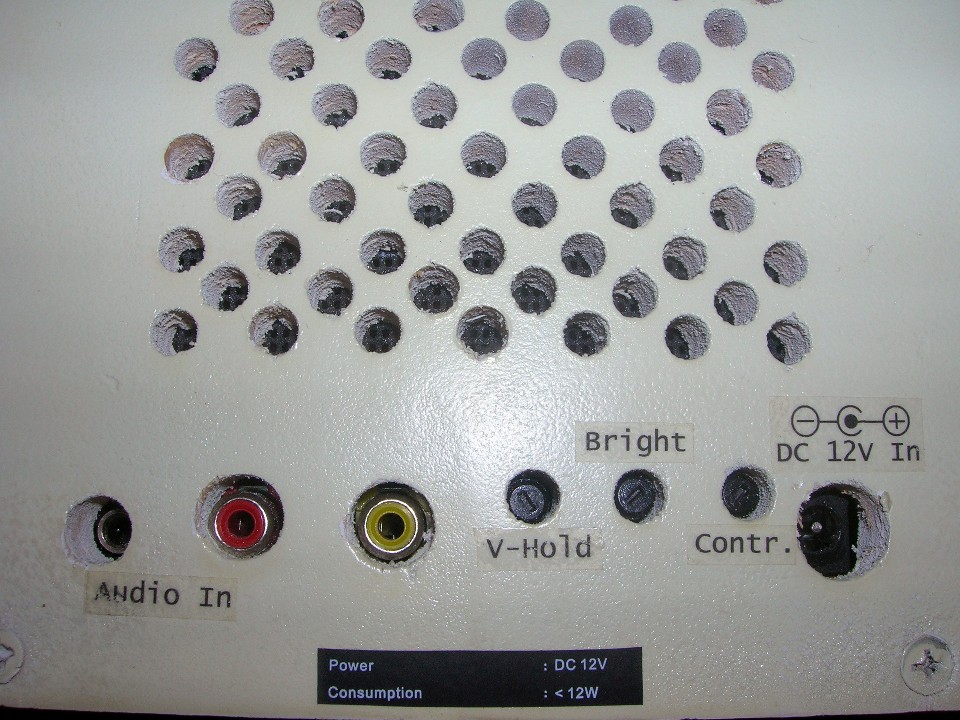
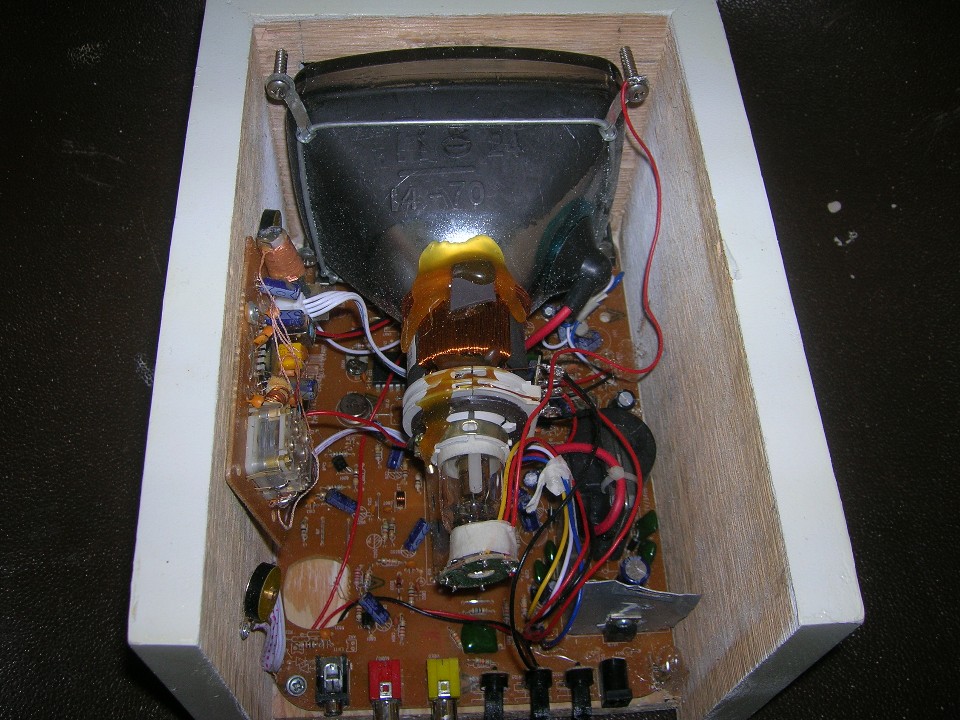
I decided to make a case for mine because I didn't want it to look like a T.V. anymore. It is simply a wooden box with a cutout for the screen and a wooden plug as the power switch. In the back I drilled holes to act as ventilation for the components inside. I also had to drill some holes for the input ports, etc. I did this by cutting out the piece in the back of the original T.V. case that had all the holes in it, and I used that as a template. No, it was not made by Hitachi, and it has absolutely no affiliation with the company. I just had that piece laying around and I thought it would be a nice touch to make the unit look even more professional.
I have the vessel hooked up to my stereo system in my room at school. The audio is fed in through my docked iPod to my stereo, and the stereo sends the signal to a speaker selector switch. I simply plugged in the vessel as a speaker, splicing the left and right signal together because a mono plug is used. It is really fun to just sit and watch the line bounce and wave around when some music is playing. It's interesting to see some patterns in the wave when certain parts of songs are playing. Every once in a while the singer or instrument will come forth with one note that dominates everything else, and the wave vessel will show a near-perfect sine pattern because it is essentially recieving the signal of only one frequency. One thing I hope to try is to play some single notes and see how the wave vessel reacts. It would be neat to compare the curve of a high C note with that of a low G, or something like that. I'm sure the resulting curves have some significance in physics and waves, but for now, it will quietly elude me. Below is a video of the visualizer in action. Sorry about audio quality, it's just the mic on my camera getting the audio.